Create your first grid
You only need to choose a price range and a paper budget. You can review everything before saving.
1. Choose a market
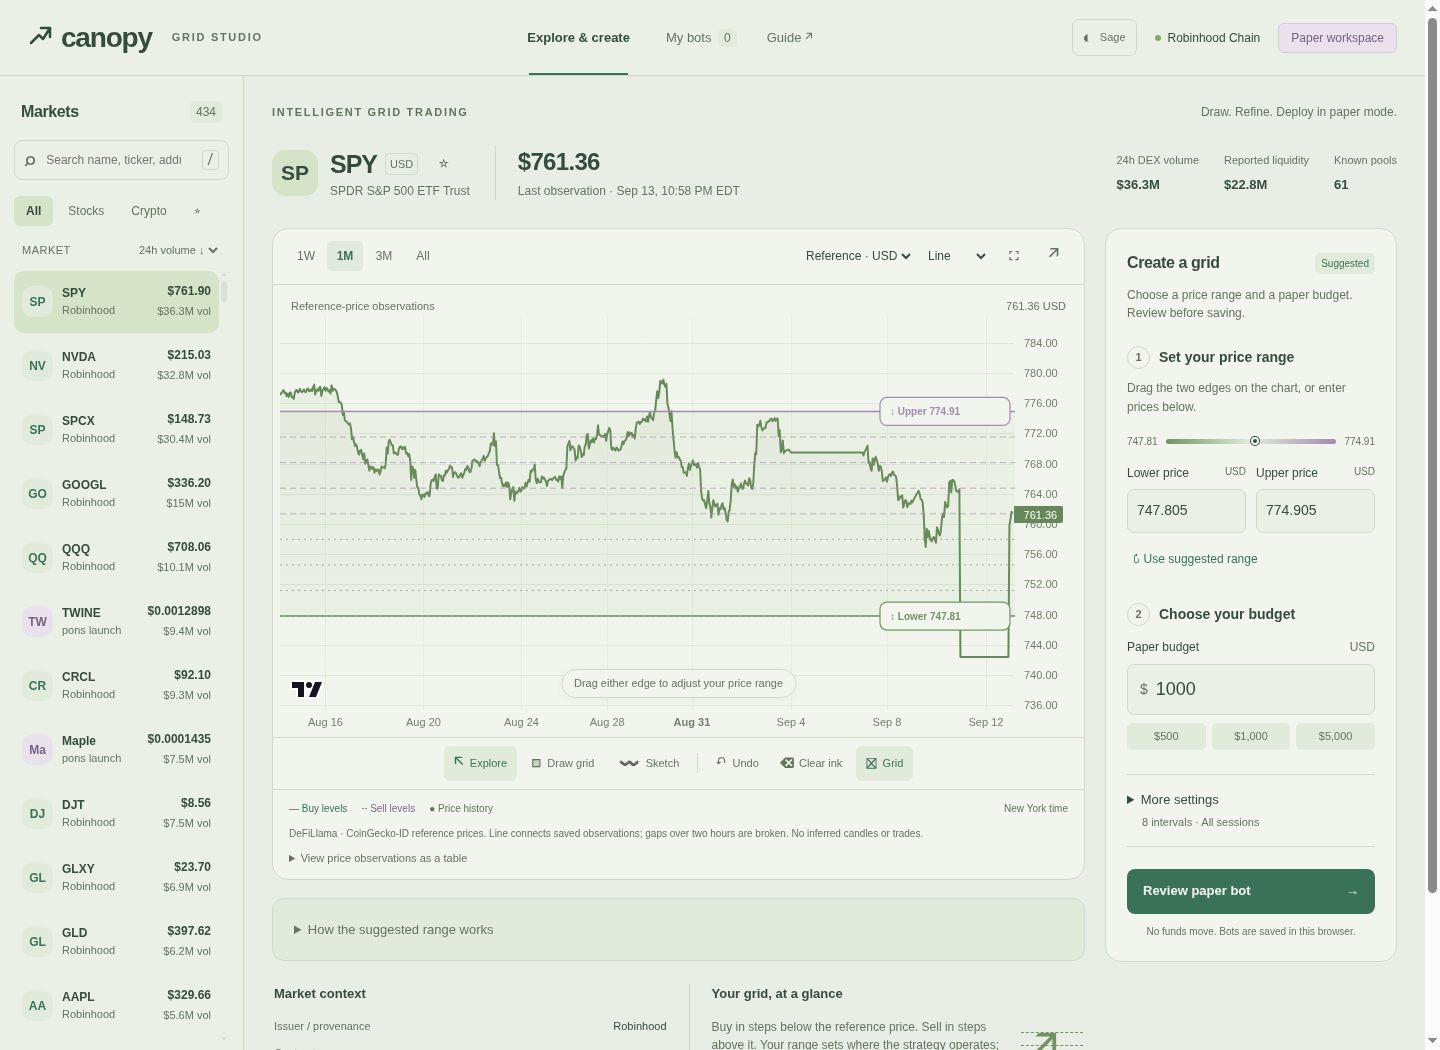
Select a market from the left-hand list. On a phone, tap Choose market. Search by ticker, name or contract address. Use the star to save a market to your watchlist.
The chart shows saved observations. Check the source and date before interpreting the prices. Use 1W, 1M, 3M or All to explore the available history.
2. Set your price range
Drag the lower and upper edge handles on the chart. The shaded band shows the prices covered by your grid. You can also enter the exact Lower price and Upper price in the Create a grid panel.
Use suggested range restores a starting range based on the saved price history. It is a research aid, not a forecast or a promise of returns. It is unavailable when there is too little history.
3. Choose a paper budget
Enter a budget or tap a preset. This is a simulation amount, not a deposit. The displayed currency matters: USD reference histories and USDG trade histories use different units.
More settings is optional. It lets you change the number of intervals, equal-price or equal-percentage spacing, and the sessions included in a replay. Its closed summary shows your current interval count and session choice.
4. Review and save
Select Review paper bot. Check the range, intervals, budget and session. Go back to edit anything, or select Deploy paper bot to save the configuration locally.
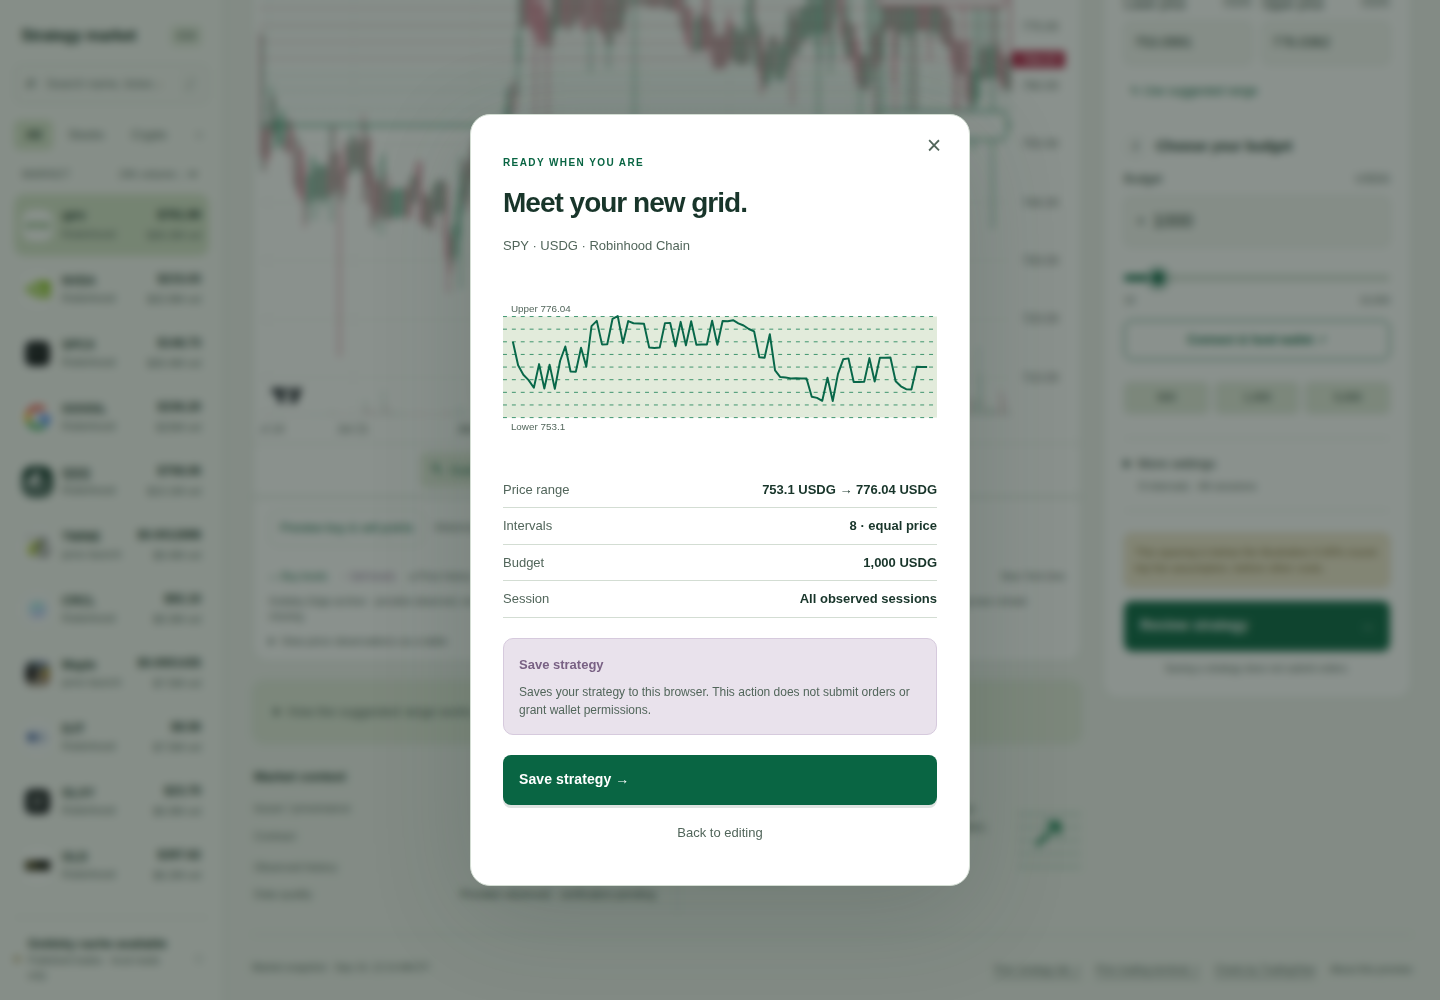
Despite the Deploy label, no transaction is signed and no bot starts trading. Your new configuration appears in My bots.
Optional drawing tools
Draw grid lets you drag out a new range. Sketch lets you draw a corridor that sets its bounds. Clear ink removes the sketch; Undo reverses a grid edit. You can always use the two price fields instead of drawing. Focus a range handle and use the arrow keys to adjust it; hold Shift for a larger step.